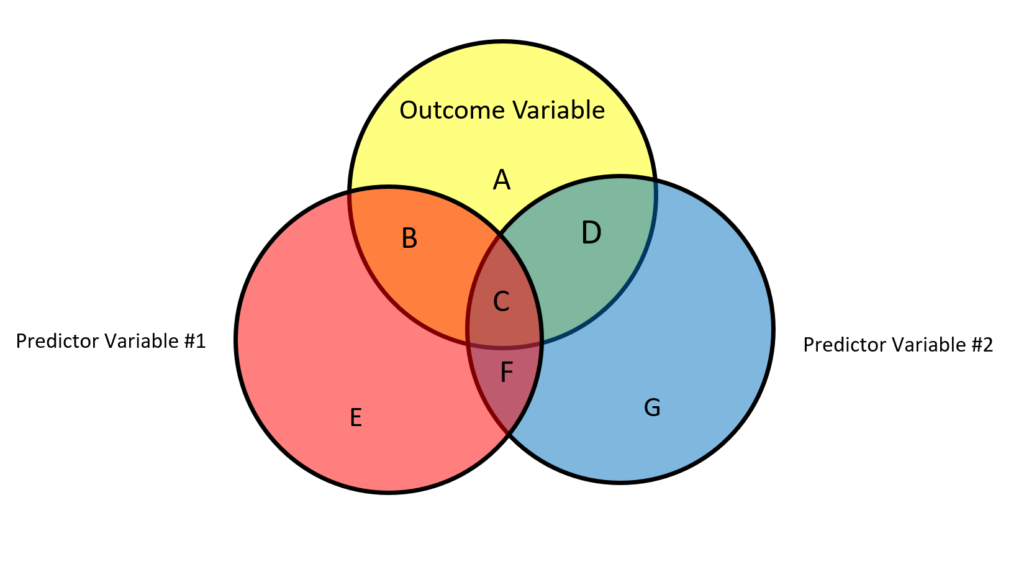
In the world of data analysis, uncovering relationships between variables is crucial. One method that helps in this endeavor is Partial Correlation.
But what exactly is Partial Correlation, and how does it differ from other correlation measures? Let’s understand this all with scenarios, calculations and interpretations with biological data examples.
Also learn more about 6 Types of Biological Data and Their Formats.
What is Partial Correlation?
Partial correlation is a statistical technique used to measure the strength and direction of the relationship between two variables while controlling for the influence of one or more additional variables. In simpler terms, it helps in understanding the unique relationship between two variables after removing the effect of other variables.
Suppose we want to study the relationship between the amount of time spent studying (variable A) and students’ exam scores (variable B). However, we recognize that other factors, such as students’ prior knowledge (variable C), could also affect exam scores.
In this case, we use partial correlation to analyze the relationship between studying time and exam scores while controlling for the influence of prior knowledge.
Formula and Calculation
The formula for calculating partial correlation involves the correlation coefficient between two variables while controlling for the effect of other variables.
Mathematically, it can be expressed as:

Here, ρ{xy.z} represents the partial correlation coefficient between variables x and y, controlling for variable z. The ρ symbols denote the Pearson correlation coefficients between respective variables.
A value close to 1 would indicate a stronger positive relationship, while a value close to 0 would suggest a weaker relationship.
Understanding Pearson Correlation
Pearson correlation is one of the most widely used measures of correlation, which assesses the linear relationship between two variables. It measures the degree to which the relationship between two variables can be described by a straight line. Pearson Correlation can be calculated using the formula:

Here, ρ{xy} represents the Pearson correlation coefficient between variables x and y, μ denotes the mean, σ represents the standard deviation, and n is the number of data points.
Is Pearson a Partial Correlation?
No, Pearson Correlation is not a form of partial correlation. While Pearson correlation measures the strength and direction of the relationship between two variables, partial correlation assesses this relationship while controlling for the influence of other variables.
Partial Correlation vs. Bivariate Correlation (Zero-order Correlation)
The main difference between partial correlation and bivariate Correlation lies in the consideration of additional variables. Bivariate correlation or also known as Zero-order Correlation assesses the relationship between two variables without considering any other variables. On the other hand, partial correlation evaluates the relationship between two variables while controlling for the influence of other variables.
Learn more about Bivariate Analysis and Bivariate Data here.
Partial Correlation vs. Multiple Correlation
While partial correlation focuses on assessing the relationship between two variables while controlling for the effect of others, Multiple correlation involves assessing the relationship between one variable and a set of other variables simultaneously. In Multiple Correlation, the aim is to understand how multiple independent variables collectively relate to a single dependent variable.
Partial Correlation vs Semi Partial Correlation
In partial correlation, the effects of all other variables except one are controlled for. This means that when assessing the relationship between two variables (let’s call them A and B), all other variables (C, D, E, etc.) are taken into account, and their influence on both A and B is removed.
While in semi-partial correlation, the effects of all other variables except one are controlled for, but not simultaneously. Instead, the influence of each additional variable is considered separately. When assessing the relationship between variables A and B, semi-partial correlation may control for the influence of variable C while examining the relationship between A and B, and then separately control for the influence of variable D while examining the relationship between A and B.
Semi-partial correlation provides insights into the unique contribution of each individual variable in the analysis, allowing for a more nuanced understanding of the relationships between variables.

Case Scenarios:
Let’s consider five case scenarios comprising biological data from various fields. We will partial correlation on them to understand the concept and calculations.
1. Healthcare: Patient Demographics and Treatment Outcomes
Scenario: We aim to analyze the relationship between patient demographics (age, gender, ethnicity) and treatment outcomes (recovery time, side effects) while controlling for pre-existing conditions.
Data Collection: We collect data from 100 patients, including their age, gender, ethnicity, treatment outcomes, and pre-existing conditions.
Partial Correlation Calculation:
Step 1: Calculate Pearson correlation coefficients for all pairs of variables.
- Pearson(age, recovery time) = 0.45
- Pearson(age, side effects) = -0.25
- Pearson(gender, recovery time) = 0.30
- Pearson(gender, side effects) = -0.15
- Pearson(ethnicity, recovery time) = -0.10
- Pearson(ethnicity, side effects) = 0.20
- Pearson(pre-existing conditions, recovery time) = -0.35
- Pearson(pre-existing conditions, side effects) = 0.40
Step 2: Calculate partial correlation between demographics and treatment outcomes while controlling for pre-existing conditions.
Partial(age, recovery time | pre-existing conditions)
= (0.45 – (-0.35) * (-0.25)) / √((1 – (-0.35)^2) * (1 – (-0.25)^2))
≈ (0.45 – (-0.35 * -0.25)) / √((1 – 0.1225) * (1 – 0.0625))
≈ (0.45 – (0.0875)) / √(0.8775 * 0.9375)
≈ 0.466
Similarly, calculate partial correlation for other demographic variables and treatment outcomes while controlling for pre-existing conditions.
Interpretation: A partial correlation coefficient of 0.466 suggests a moderately positive relationship between age and recovery time among patients, even after considering the presence of pre-existing conditions.
2. Biotechnology: Genetic Markers and Disease Susceptibility
Scenario: Investigating the relationship between genetic markers (gene A, gene B) and disease susceptibility (likelihood of disease) while controlling for environmental factors (exposure to toxins, diet).
Data Collection: Data collected from 50 individuals, including genetic marker data, disease susceptibility, and information on environmental factors.
Partial Correlation Calculation:
Step 1: Calculate Pearson correlation coefficients for all pairs of variables.
- Pearson(gene A, likelihood of disease) = 0.60
- Pearson(gene B, likelihood of disease) = 0.45
- Pearson(gene A, exposure to toxins) = -0.25
- Pearson(gene A, diet) = 0.15
- Pearson(gene B, exposure to toxins) = -0.20
- Pearson(gene B, diet) = 0.10
Step 2: Calculate partial correlation between genetic markers and disease susceptibility while controlling for environmental factors.
Partial(gene A, likelihood of disease | toxins, diet)
= (0.60 – (-0.25 * 0.15)) / √((1 – (-0.25)^2) * (1 – (0.15)^2))
≈ (0.60 – (-0.0375)) / √(0.9375 * 0.9775)
≈ 0.611
Similarly, calculate partial correlation for gene B and disease susceptibility while controlling for environmental factors.
Interpretation: The partial correlation coefficient of 0.611 reveals that gene A has a some role in increasing likelihood of a disease even after considering the influence of environmental factors.
3. Clinical Research: Medication Dosage and Patient Recovery Rates
Scenario: Assessing the association between medication dosage (mg) and patient recovery rates (time to recovery) while considering the influence of demographic variables (age, gender).
Data Collection: Data collected from 80 patients, including medication dosage, recovery rates, and demographic information.
Partial Correlation Calculation:
Step 1: Calculate Pearson correlation coefficients for all pairs of variables.
- Pearson(dosage, time to recovery) = -0.35
- Pearson(age, time to recovery) = 0.50
- Pearson(gender, time to recovery) = -0.20
Step 2: Calculate partial correlation between medication dosage and recovery rates while controlling for demographic variables.
Partial(dosage, time to recovery | age, gender)
= (-0.35 – (0.50 * -0.20)) / √((1 – (0.50)^2) * (1 – (-0.20)^2))
≈ (-0.35 – (-0.10)) / √(0.75 * 0.96)
≈ -0.382
Interpretation: A partial correlation coefficient of -0.382 suggests a moderately negative relationship between medication dosage and recovery rates among patients, after accounting for the effects of age and gender. This means that as medication dosage increases, recovery rates tend to decrease, adjusting for differences in age and gender among patients.
4. Environmental Science: Pollution Levels and Respiratory Illnesses
Scenario: Exploring the correlation between pollution levels (PM2.5) and respiratory illnesses (asthma cases) while controlling for socio-economic factors (income, education).
Data Collection: Data collected from 60 communities, including pollution levels, asthma cases, and socio-economic data.
Partial Correlation Calculation:
Step 1: Calculate Pearson correlation coefficients for all pairs of variables.
- Pearson(PM2.5, asthma cases) = 0.40
- Pearson(income, asthma cases) = -0.30
- Pearson(education, asthma cases) = -0.25
Step 2: Calculate Partial Correlation between pollution levels and respiratory illnesses while controlling for socio-economic factors.
Partial(PM2.5, asthma cases | income, education)
= (0.40 – (-0.30 * -0.25)) / √((1 – (-0.30)^2) * (1 – (-0.25)^2))
≈ (0.40 – (0.075)) / √(0.91 * 0.9375)
≈ 0.448
Interpretation: A partial correlation coefficient of 0.448 suggests a moderately positive relationship between pollution levels (PM2.5) and respiratory illnesses (asthma cases), after accounting for socio-economic factors such as income and education. This means that as pollution levels increase, the number of asthma cases tends to increase, adjusting for differences in income and education levels across communities.
5. Genomic Data Science: Gene Expressions and Disease Progression
Scenario: Studying the relationship between gene expressions (gene X, gene Y) and disease progression (severity of symptoms) while accounting for the effects of other genes (gene Z, gene W).
Data Collection: Data collected from 70 patients, including gene expression data, disease progression, and information on other genes.
Partial Correlation Calculation:
Step 1: Calculate Pearson correlation coefficients for all pairs of variables.
- Pearson(gene X, severity of symptoms) = 0.55
- Pearson(gene Y, severity of symptoms) = 0.60
- Pearson(gene X, gene Z) = -0.25
- Pearson(gene X, gene W) = 0.20
- Pearson(gene Y, gene Z) = -0.30
- Pearson(gene Y, gene W) = 0.35
Step 2: Calculate partial correlation between gene expressions and disease progression while controlling for the effects of other genes.
Partial(gene X, severity of symptoms | gene Z, gene W)
= (0.55 – (-0.25 * 0.20)) / √((1 – (-0.25)^2) * (1 – (0.20)^2))
≈ (0.55 – (-0.05)) / √(0.9375 * 0.96)
≈ 0.604
Interpretation: The positive sign (0.604) indicates that as gene X expressions increase, the severity of symptoms tends to increase. This means that higher expressions of gene X are associated with a greater severity of symptoms of the disease, even after considering the influence of other genes.
Conclusion
In conclusion, Partial Correlation serves as a valuable tool in various data science fields, allowing researchers to analyze relationships between variables while considering the influence of other factors. Through step-by-step calculations and interpretations, we gain insights into complex datasets, aiding decision-making and further research endeavors in Biological Data Science.
Explore more about 8 Biological Data Science Careers in 2024 To Look Forward To.


